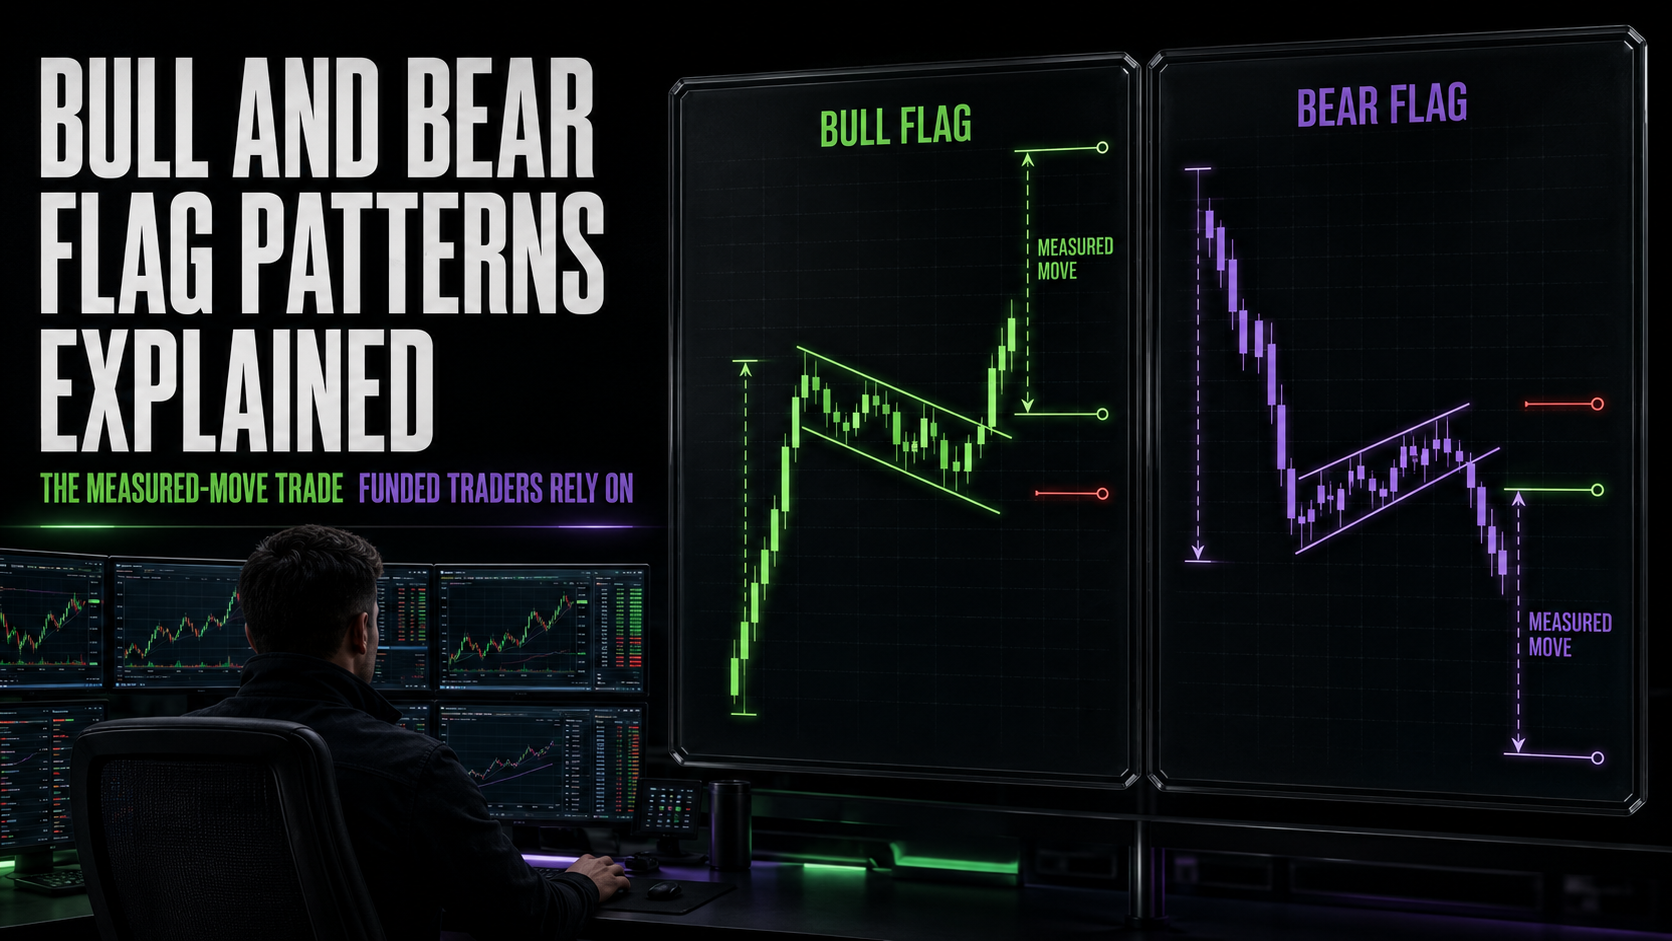
Bull and Bear Flag Patterns Explained: The Measured-Move Trade Funded Traders Rely On
The flag is the most-traded continuation pattern in futures for a reason: defined risk, a built-in target, and a volume signature that tells you when to believe it. Here is the full anatomy, a worked NQ example with real numbers, the failure signals, and why the pattern suits funded-account math.
 Tradeify
 My Funded Futures
 Top One Futures
 Alpha Futures
 Apex Trader Funding
 Lucid Trading
 BlueSky Funded
 Topstep
 Take Profit Trader
 Trade Day
 Phidias
 Earn2Trade
 Bulenox
 Funded Next Futures
 Blue Guardian Futures
 The Trading Pit
 Funded Futures Family
 E8 Markets
 Daytraders
 Elite Trader Funding
 Funded Futures Network
 Blueberry Futures
 Taurus Arena
 Humble Futures
 Legends Trading
 Savius
 Futures Elite
 NexGen Protrader
 Funded Seat
 YRM Prop
 FundedNext
 E8 Markets
Last updated: July 13, 2026
Strip trading education down to the patterns professionals actually still trade and the flag survives every cut, because it encodes something structurally true about markets: strong moves pause, weak hands take profits, and if the move was real, it resumes. Everything else about the pattern (the volume signature, the measured-move target, the shallow-versus-deep distinction) is machinery for answering one question: was the pause a rest or a top?
This is the full playbook. It covers the anatomy and its variants, a six-point grading checklist that filters the many flags a session prints down to the few worth risking money on, the three entry techniques and their exact trade-offs, three fully numbered worked trades (including a losing one managed correctly, because that trade teaches more than the winners), the management models and the expectancy math behind each, the session-timing map of when flags work and when they trap, drawdown-based sizing tables, a backtest protocol, and the mistake catalog.
What this is and is not: an educational explainer of a classic methodology, not trade advice or a promise of edge. Validate anything here in sim against your specific evaluation's rules before fees are at risk.
Anatomy: Pole, Flag, Break
A bull flag has three components, and each carries its own requirement:
- The flagpole: a sharp, nearly one-directional advance on expanding volume. The pole is the pattern's engine and its information content: it proves initiative buyers were willing to pay up aggressively. A grinding, overlapping climb is not a pole, and flags without real poles are just ranges wearing the costume. Practical tests for pole quality: the advance covers meaningful ground relative to recent average range (a pole worth trading on a 5-minute NQ chart is typically several times the average 5-minute bar), the bars overlap little, and closes sit in the upper portion of their bars.
- The flag: a narrow consolidation drifting down (or sideways) against the pole, contained in a rough channel, on visibly declining volume. The drift-against-trend is profit-taking; the shrinking volume says no aggressive sellers showed up to press the other side. Depth is the critical filter: a healthy flag retraces less than about half the pole, the strongest hold the upper third, and beyond roughly 61.8 percent most systematic traders void the pattern entirely. Duration matters too: on intraday charts, flags that resolve within roughly 3 to 15 bars keep the pole's energy; consolidations that drag on for dozens of bars bleed it, and the eventual break carries less information.
- The break: price clears the flag's upper boundary on expanding volume. The volume expansion is the confirmation; a drifting, low-volume poke above the channel is the trap signature, not the trigger.
A bear flag mirrors everything: sharp decline, upward-drifting low-volume pause, breakdown on expansion. The family variants, so you file them correctly: the pennant (same pole, but the pause converges into a small symmetrical triangle rather than a parallel channel; identical trading logic, with the apex adding a time constraint since pennants that reach their apex without breaking lose force); the tight flag (a two-to-four bar sideways pause holding near the pole high, the most aggressive continuation signal in the family because sellers could not push price down at all); and the sloppy flag (wide, overlapping, deep, volume erratic), which is not a variant but a rejection: the name for what you pass on. All of them belong to continuation patterns: they bet with the pole, never against it.
The Six-Point Grade: Separating Tradeable Flags From Wallpaper
A liquid futures session prints flags constantly, and the edge (to whatever extent your testing finds one) lives entirely in selection. Grade every candidate on six binary checks before considering an entry; the discipline of scoring kills the impulse trades that make pattern traders unprofitable.
| # | Check | Pass Condition | Why It Matters |
|---|---|---|---|
| 1 | Pole quality | Sharp, low-overlap advance on expanding volume, several times average bar range | The pole is the evidence; weak poles carry no information to continue |
| 2 | Flag depth | Retraces less than 50 percent of the pole (upper third is ideal) | Deep pullbacks are reversals wearing a flag costume; odds degrade sharply past half |
| 3 | Volume signature | Contracting through the flag, expanding on the break | Half the pattern is the volume; without it you have a shape, not a setup |
| 4 | Higher-timeframe alignment | The next timeframe up is trending the same direction (5-min flag inside a 15-min uptrend) | Counter-trend flags are the lowest-quality instances regardless of local perfection |
| 5 | Location | Breaking into open space: thin volume overhead, not into a major HVN shelf, prior day high, or naked POC sitting ticks away | A perfect flag breaking into a wall has its target confiscated by structure; the profile map grades this in seconds |
| 6 | Time and calendar | Trending session window (post-open drive legs, post-news resolution), no scheduled release inside the flag | Midday chop manufactures fake flags; news inside the pause voids the volume logic entirely |
A working standard: six of six is an A trade at full planned risk, five of six is a B trade at reduced size, and anything below five is wallpaper. Traders who log their grades discover quickly that nearly all their losses came from the trades they knew were Bs and Cs at entry, which is the cheapest performance upgrade in pattern trading.
The Three Entries, and What Each Costs You
| Entry | Trigger | What You Gain | What You Pay |
|---|---|---|---|
| Breakout entry | Buy the close (or stop order) through the flag's upper boundary on expanding volume | Confirmation; you only ever enter working patterns | The worst price and the widest stop; vulnerable to breakout-and-fail traps |
| Retest entry | After the break, buy the pullback that tests the broken boundary and holds | Better price, tighter stop, and the trap flags often reveal themselves before you enter | Runaway breaks never come back; you miss the strongest instances |
| Anticipation entry | Buy inside the flag at the channel's lower edge, before any break | The best price and tightest stop of the three, with the target unchanged | No confirmation; a meaningful share of your entries will be in flags that never break |
There is no universally correct row; there is a correct row for a risk budget and a temperament. Two hybrid tactics worth knowing: a split entry (half anticipation at the channel low, half on the confirmed break) averages the trade-offs and is popular precisely because it converts an either-or into a portfolio; and on stop-order breakout entries, placing the stop order a tick or two beyond the obvious boundary avoids the cluster of identical orders resting exactly at it, which is where the fast shakeout wicks hunt. Which brings us to the numbers.
Worked Trade 1: A Bull Flag on NQ, With Funded-Account Math
Morning session, Nasdaq futures, fifteen minutes after an open-drive start (grade check 6 passing already). NQ rallies from 21,440 to 21,530: a 90-point pole on strong expanding volume, low overlap (check 1). Price then drifts down in a tight channel to 21,505 over twenty minutes on visibly shrinking volume: a 25-point flag retracing barely a quarter of the pole (checks 2 and 3). The 15-minute chart is in a clean uptrend (check 4), and the profile map shows thin overnight volume overhead with the nearest meaningful shelf 100+ points away (check 5). Six of six: an A trade at full risk.
- Entry: the flag breaks at 21,515 on an expansion bar; you take the breakout entry there.
- Stop: below the flag low with a small buffer, 21,500, so your risk is 15 points. The pattern picked this number, not you: if price trades back through the entire flag, the pattern is void and there is nothing left to be wrong about slowly.
- Target: the measured move projects the 90-point pole from the breakout: 21,515 + 90 = 21,605. Management (model B below): partial at half the move (21,560, a 45-point gain against 15 risked, 3R banked), stop to entry, remainder toward the full projection.
- Sizing, the funded-account way: suppose you trade a $50K evaluation with a $2,000 drawdown and risk 1 percent of the real account (the drawdown, per our drawdown guide) per trade: $20 of risk. Fifteen points on one Micro Nasdaq contract is 15 × $2 = $30, already above budget, so this specific trade is one MNQ only if you consciously widen the risk budget to 1.5 percent, or it is a pass. That is not a disappointing conclusion; it is the pattern and the drawdown doing exactly what they are supposed to do: producing a precise, non-negotiable size before entry. Failing traders in the industry data risk 2 to 3 percent per trade on vibes; this arithmetic is the alternative.
Worked Trade 2: A Bear Flag Short on ES
Same machinery, other direction, different entry technique. Early afternoon, ES breaks down from 6,298.00 to 6,283.00 on a burst of selling: a 15-point pole (60 ticks) with expanding volume. Price drifts up in a narrow channel to 6,288.50 over a dozen 5-minute bars on fading volume: a 5.5-point flag retracing about a third of the pole. The 15-minute trend is down, and the flag is forming just above a thin LVN corridor from the morning profile, meaning the breakdown has vacuum below it. Checks pass.
- Entry: this time the retest entry. Price breaks the flag's lower boundary at 6,286.00, extends to 6,283.50, then pulls back up to retest 6,286.00, stalls, and prints a rejection bar. Short at 6,286.25.
- Stop: above the flag high at 6,289.25: 3 points (12 ticks) of risk, roughly half what the breakout entry would have required. This is the retest entry's whole argument.
- Targets: measured move projects 15 points from the break: 6,286.00 - 15 = 6,271.00. Partial at half (6,278.50, about 2.6R on the tightened stop), remainder to the full move, which happens to sit just above a naked POC at 6,270.25, a confluence that upgrades confidence in the terminal target.
- Sizing: 12 ticks on MES is 12 × $1.25 = $15, inside a $20 budget at one contract; on ES it is $150, which on the same $2,000 drawdown is 7.5 percent and completely unserious. The tighter retest stop is what makes this trade sizeable at all: entry technique and position size are the same decision wearing two hats.
Worked Trade 3: The Failed Flag, Managed Correctly
This is the trade that decides whether flag trading works for you, because the pattern will fail regularly and the entire business model depends on failures costing 1R. Setup: NQ prints a 60-point pole into late morning, flags for 20 points on declining volume, five of six checks pass (the miss: the 15-minute chart is going sideways, not up). You take it anyway at reduced size, per the grading rule. Entry on the break at 21,772, stop under the flag at 21,758, risk 14 points.
- What happens: the breakout bar closes strong at 21,779, the next bar stalls, and the bar after that closes at 21,768: back inside the flag. That close is the trap signature from the failure list, and it is a mechanical instruction, not a discussion prompt.
- The correct action: exit on the close back inside, at 21,768, for a 4-point loss (about 0.3R), rather than waiting for the 14-point stop. The re-entry close is an earlier, higher-information exit that the pattern's own logic licenses: a real breakout does not return to the scene. Price subsequently broke the flag low and traded 40 points lower; the pattern was not just failing, it was inverting, as trapped breakout buyers became the fuel for the move down (which is precisely the mechanism liquidity-based traders hunt from the other side).
- The lesson in one line: flag traders do not lose money on failed flags; they lose it on failed flags they argued with. The full stop is the disaster ceiling; the re-entry close is the working exit. Logging both prices on every loser will show you how much that habit is worth per hundred trades.
Management Models and the Expectancy Math
How you manage the winner determines what win rate you need, and most flag traders have never done this arithmetic. Three standard models on a trade risking 1R with a measured move worth roughly 6R of open potential (the NQ example's geometry):
| Model | Rules | Average Win (approx.) | Breakeven Win Rate | Character |
|---|---|---|---|---|
| A: All-out at half measured move | Full exit at the 50 percent projection (3R in the NQ example) | ~3R | 25% | Highest hit rate, steadiest equity curve, leaves the home runs on the table |
| B: Two-stage (the default) | Half off at 50 percent projection, stop to entry, half to full measured move | ~3 to 4.5R blended | ~20% | Banks proof, keeps a runner; the breakeven stop converts some winners into scratches |
| C: Runner model | Third off at 1.5R, third at half projection, final third trailed under swing structure past the full move | Highly variable; fat right tail | ~15 to 18% | Lowest hit rate feel, largest occasional wins; psychologically hardest to execute |
Three implications worth internalizing. First, the pattern's geometry is forgiving: even Model A breaks even at a 25 percent win rate, which is why selection (the six-point grade) matters more than prediction. Second, the popular habit of moving the stop to breakeven immediately is expensive: it converts normal post-breakout retests into scratches on trades that then work; Model B's version (breakeven only after the first partial is banked) keeps the protection while giving the trade room to breathe. Third, for funded accounts specifically, Models A and B produce the frequent moderate green days that consistency rules reward, while Model C's fat-tail days are exactly what a 30 or 40 percent consistency check flags; if your firm runs a tight consistency rule, the management model is a compliance decision as much as a performance one.
One more management tool the models share: the time stop. A breakout that goes nowhere for several bars while volume dies has lost its expansion premise even without triggering any price-based exit; scratching stale breakouts is the same profit center here that it is in rotation trading.
When Flags Work: The Session Map
- Prime windows: the trend legs following the first 30 to 90 minutes of the US session (poles form at the open, flags resolve in the drive), and the resolution phase after major scheduled news once the initial two-way violence settles into a direction. These windows supply the two ingredients flags need: initiative participation and follow-through.
- The dead zone: the midday lull manufactures the most flag-shaped objects and honors the fewest, because the pole-makers have gone to lunch. A flag needs someone left to continue the move; volume tells you whether anyone is home, and check 6 exists because most traders will not pass on a pretty pattern without a rule forcing them to.
- Instrument notes: NQ prints more and faster flags with more shakeout wicks (favoring retest entries and buffer ticks on stops); ES prints cleaner but fewer (breakout entries more viable); CL trends hard when it trends and produces violent trap flags around inventory data. The pattern is universal; the execution details are not.
Sizing Against a Real Drawdown: The Reference Table
Since the stop distance is pattern-defined, sizing reduces to a lookup. At 1 percent risk per trade on common evaluation drawdowns, the maximum stop distance one micro contract allows:
| Drawdown (account) | 1% Risk Budget | Max Stop, 1 MNQ ($2/pt) | Max Stop, 1 MES ($1.25/tick = $5/pt) |
|---|---|---|---|
| $1,000 (typical 25K) | $10 | 5 points | 2 points (8 ticks) |
| $2,000 (typical 50K) | $20 | 10 points | 4 points (16 ticks) |
| $3,000 (typical 100K) | $30 | 15 points | 6 points (24 ticks) |
| $4,500 (typical 150K) | $45 | 22 points | 9 points (36 ticks) |
Read the table backward and it becomes a setup filter: on a 25K account, only tight flags with sub-5-point stops on MNQ are sizeable at 1 percent, which pushes small-drawdown accounts toward the tight-flag variant and retest entries structurally, not stylistically. This single table, applied without exceptions, removes the oversizing failure mode responsible for most first-week evaluation deaths in the industry's failure data.
Backtesting Flags Honestly
Flags resist naive backtesting because "a flag" is a judgment; the fix is to freeze the judgment into arithmetic and test that. A workable mechanical definition to start from: pole = an advance of at least K × ATR(14) within N bars with at most one countertrend close; flag = the subsequent M-bar (3 to 15) consolidation whose depth stays under 50 percent of the pole and whose average volume runs below the pole's; entry = close beyond the flag boundary with volume above the flag average; stop = flag extreme plus a buffer; exits = the three management models above, tested separately. Then split results by the grading checks (with and without HTF alignment, by session window, by depth bucket), because the aggregate number hides where the pattern actually lives: expect the edge, if your market has one, to concentrate almost entirely in the A-grade subset and the prime windows, which is the statistical restatement of everything this guide has argued. Sample discipline as always: hundreds of instances, multiple volatility regimes, sim forward-test before fees. If the frozen version shows nothing, be suspicious of the discretionary version's screenshots, including your own.
The Mistake Catalog
- Deep flags. Retracements beyond half the pole convert the odds toward a coin flip. Pass, whatever the shape looks like.
- Wrong volume. Volume that stays elevated inside the flag means the selling is real; a breakout on unchanged volume means conviction never arrived. The volume signature is not decoration, it is half the pattern.
- Arguing with the re-entry close. Price breaking out and closing back inside the flag is the mechanical exit. Every point of hope past it is donated.
- Fighting the bigger picture. A 5-minute bull flag inside a daily downtrend, below value, into overhead supply is a low-quality instance regardless of local perfection. Checks 4 and 5 exist because the pattern grades context poorly on its own.
- Trading every flag at one size. The grade exists to modulate risk; A trades and C trades at identical size is how a 55 percent methodology loses money.
- Instant breakeven stops. Protecting a trade that has proven nothing yet converts working setups into scratches. Earn the breakeven with the first partial.
- News inside the flag. A scheduled release mid-pattern voids the volume logic entirely; the pause is positioning, not profit-taking. Check the calendar, and remember several firms restrict news-window trading on funded accounts anyway.
Why the Pattern Fits Funded-Account Math
Three structural alignments, beyond any question of win rate. First, the risk is defined by the pattern before entry: the stop belongs at the far side of the flag, which converts directly into contracts against your remaining drawdown via the table above, the sizing discipline that separates the 14 percent who pass from the rest. Second, the measured move enforces profit-taking: an objective target set before entry is the antidote to the give-it-all-back round trip, and on intraday timeframes with micro contracts it produces the frequent moderate wins that consistency rules reward rather than punish. Third, the pattern is timeframe-agnostic and day-trading-native: it forms constantly on the 2, 5, and 15-minute charts of ES and NQ during regular hours, which fits the auto-flat, no-overnight structures most futures firms mandate. The honest limitation is selection: flags are common, good flags are not, and the edge, to whatever extent your testing finds one, lives entirely in the six checks and the session map, not in the shape itself.
Flag Pattern FAQ
What is a bull flag?
A sharp high-volume advance (the pole) followed by a narrow, downward-drifting, low-volume pause (the flag), resolved by a breakout on expanding volume. A bear flag is the mirror image.
How do I set the target?
Measured move: project the pole's height from the breakout point. Common management takes partial profit at half the projection and lets the remainder work toward the full move.
How deep can the flag pull back?
Under half the pole, ideally holding the upper third. Past 50 percent the continuation odds degrade toward a coin flip, and past roughly 61.8 percent most systematic traders void the pattern.
How do I know a flag is failing?
Deep retracement, volume that never contracts in the flag or never expands on the break, formation against the higher-timeframe trend or into a volume shelf, and above all the close back inside the flag after a breakout, which is the mechanical exit signal, taken immediately rather than waiting for the full stop.
What win rate do I need?
Less than most assume: with pattern-defined 1R stops and measured-move targets, the all-out-at-half-move model breaks even near a 25 percent win rate and the two-stage model near 20 percent. Selection quality moves the realized rate; management style decides what rate you need.
Is this suitable for evaluations?
Structurally it aligns well: pattern-defined stops for precise drawdown-based sizing (see the reference table above), objective targets, and a base-hit profile that suits consistency rules. Suitability for you is an empirical question: test it in sim against your evaluation's exact rules first.
Educational content only, never personalized financial advice or a recommendation to trade any strategy. Trading futures involves substantial risk of loss. Prop trading involves risk of losing evaluation fees; most participants do not reach a payout.