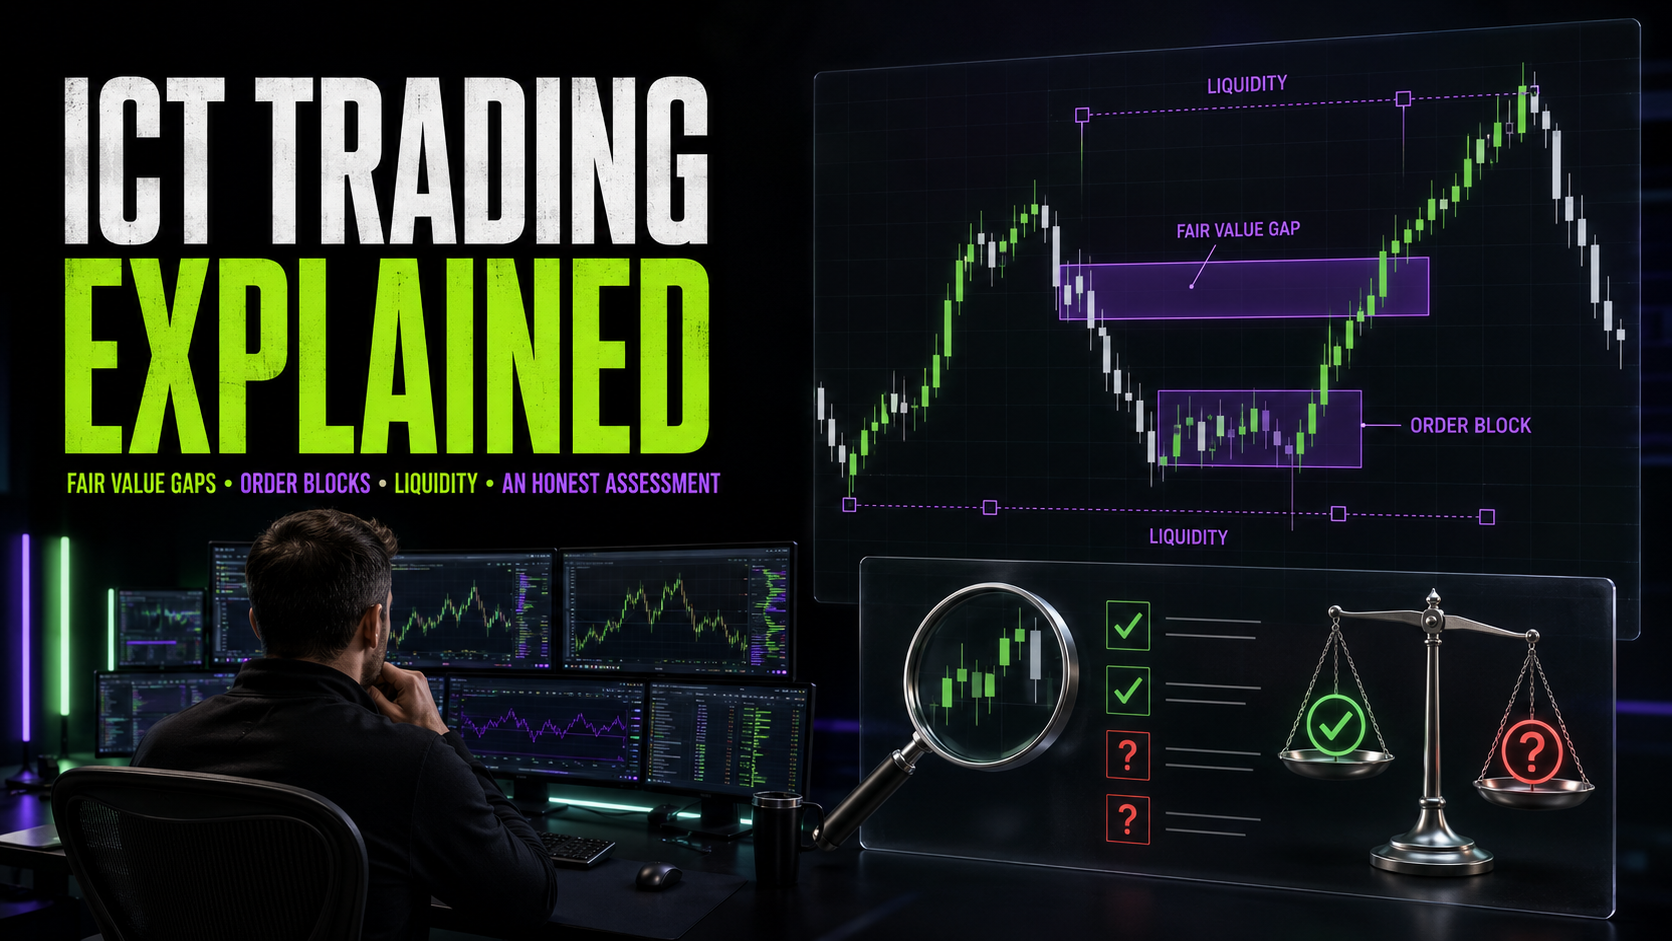
ICT Trading Explained: Fair Value Gaps, Order Blocks, Liquidity, and an Honest Assessment
ICT is the most searched trading methodology of the decade and the most argued about. Here is what the concepts actually are, from fair value gaps to liquidity sweeps to killzones, why they resonate with prop traders, what the critics get right, and which pieces you can genuinely test.
 Tradeify
 My Funded Futures
 Top One Futures
 Alpha Futures
 Apex Trader Funding
 Lucid Trading
 BlueSky Funded
 Topstep
 Take Profit Trader
 Trade Day
 Phidias
 Earn2Trade
 Bulenox
 Funded Next Futures
 Blue Guardian Futures
 The Trading Pit
 Funded Futures Family
 E8 Markets
 Daytraders
 Elite Trader Funding
 Funded Futures Network
 Hola Prime
 Blueberry Futures
 Taurus Arena
 Humble Futures
 Legends Trading
 Savius
 Futures Elite
 NexGen Protrader
 Funded Seat
 YRM Prop
 FundedNext
 E8 Markets
Last updated: July 13, 2026
No trading methodology of the past decade has spread like ICT. Walk into any prop firm Discord and half the chart screenshots are marked up with fair value gaps and liquidity levels; "ICT" out-searches almost every classical strategy term on Google; and the funded-trading boom and the ICT boom happened to the same generation at the same time, which is not a coincidence. It is also the most argued-about methodology in trading, praised as the first honest explanation of why retail stops get run and dismissed as unfalsifiable pattern-painting, sometimes by the same person in the same month.
This guide does what most ICT content refuses to do: define every core concept precisely enough to be tested, lay out the full model workflow from daily bias to entry, give killzone times you can convert to your timezone, walk two fully numbered trades (one winner, one failed sweep managed correctly, because the failure teaches the filter), collect the tricks practitioners actually rely on and the errors that empty accounts, and then assess the whole edifice honestly: what the critics get right, what the dismissals miss, and exactly how to find out whether any of it works on your market.
What this is and is not: an educational explainer and evaluation of a methodology, not an endorsement, not trade advice, and not a claim of edge in either direction. We review prop firms the same way: what traders report, stated plainly.
The Premise, and Where It Came From
ICT is the teaching handle of Michael J. Huddleston, the Inner Circle Trader, whose free video curriculum spawned the broader "Smart Money Concepts" ecosystem now taught, remixed, and indicator-ized across the internet. The foundational premise inverts the retail textbook: where classical technical analysis says support holds and breakouts continue, ICT says price is drawn to liquidity, meaning the clusters of stop-loss and breakout orders resting at obvious levels, and that large participants need those resting orders to fill size. The practical consequence: the obvious level is not where the move starts, it is what the move consumes first. Old highs get poked before reversals, equal lows get swept before rallies, and the trader who bought the clean breakout becomes the liquidity.
Hold one distinction through everything that follows, because it decides how you should use the material. The mechanical claim is that dense stop clusters at obvious levels create observable sweep-and-reverse dynamics: this is testable, and it overlaps with what market microstructure research documents about stop clustering and price behavior around round numbers and prior extremes. The intent claim is that specific institutions deliberately engineer these moves against retail traders: this is a narrative, it is unfalsifiable from a price chart, and, as the avoid list will argue, believing it too literally is itself a trading hazard. Every useful piece of ICT survives on the mechanical claim alone.
The Core Concepts, Precisely
| Concept | Definition | How It Is Used |
|---|---|---|
| Liquidity (buy-side / sell-side) | Resting orders above highs (buy stops) and below lows (sell stops); equal highs/lows are treated as especially dense pools | Mapped as targets: price is expected to seek these pools |
| Internal vs external liquidity | External: the pools at range extremes (old highs/lows). Internal: the inefficiencies inside the range (FVGs, order blocks) | The alternation heuristic: after external liquidity is taken, price seeks internal, and vice versa; this generates the target after every entry |
| Liquidity sweep / stop run | A push through such a level followed by reclaim and reversal | The reversal trigger: entries are taken after the sweep, not at the level |
| Inducement | A minor, obvious pool created just before a real zone (a small pullback low sitting above an order block) | A trap filter: the first grab often takes the inducement, not the real level; patient entries wait for the deeper purge |
| Fair value gap (FVG) | A three-candle imbalance where candle 1 and candle 3 do not overlap, leaving untraded space | A retracement entry zone; the gap's 50 percent midpoint is called consequent encroachment (CE) and is the common fill reference |
| Order block | The last opposing candle before a strong displacement (e.g. the final down candle before a rally) | A supply/demand zone for entries on retest; validity requires the displacement that follows it |
| Breaker block | An order block that failed (was traded through) and is then retested from the other side | A polarity-flip entry zone: old demand becomes supply after it breaks, and vice versa |
| Mitigation block | Like a breaker, but formed from a swing that failed to make a new extreme before the reversal | Same polarity-flip use; the distinction from breakers is definitional bookkeeping more than tactics |
| Displacement | An aggressive, imbalance-leaving move away from a level | The validity filter: order blocks and structure shifts only "count" when created by displacement |
| Market structure shift (MSS / BOS / CHoCH) | Price breaking the swing pattern (a lower-low sequence printing a higher high, or vice versa), ideally with displacement | The trend-change confirmation that licenses reversal entries; BOS = continuation break, CHoCH = first countertrend break |
| Premium / discount and OTE | The upper and lower halves of a dealing range (measured swing low to swing high); the "optimal trade entry" zone sits at the 62 to 79 percent retracement | Location filter: buy in discount, sell in premium, ideally where an FVG overlaps the OTE zone |
| SMT divergence | Correlated instruments disagreeing at a level: ES makes a new high, NQ fails (or vice versa) | A confirmation filter: the non-confirming index flags the move as a probable sweep rather than genuine strength |
| Power of Three (PO3) | The accumulation, manipulation, distribution template for a session or day: range, false move against the true direction, then the real move | The daily narrative: the manipulation leg (the "Judas swing") is the sweep you trade against |
| Killzones | Defined session windows where the setups are taken (times below) | Time filter: setups outside the windows are ignored regardless of shape |
Killzones: The Times, in Your Timezone
ICT treats time as half the setup: the same pattern at 3:00 AM and 9:45 AM New York time is two different trades. The windows, with conversions for the international traders who dominate the funded space (times shown for New York daylight saving; shift one hour when the US is on standard time):
| Killzone | New York (ET) | London (BST) | India (IST) | Jakarta (WIB) | São Paulo (BRT) |
|---|---|---|---|---|---|
| Asia range | 8:00 PM to 12:00 AM | 1:00 to 5:00 AM | 5:30 to 9:30 AM | 7:00 to 11:00 AM | 9:00 PM to 1:00 AM |
| London open | 2:00 to 5:00 AM | 7:00 to 10:00 AM | 11:30 AM to 2:30 PM | 1:00 to 4:00 PM | 3:00 to 6:00 AM |
| New York AM (primary for index futures) | 7:00 to 10:00 AM | 12:00 to 3:00 PM | 4:30 to 7:30 PM | 6:00 to 9:00 PM | 8:00 to 11:00 AM |
| New York PM | 1:30 to 4:00 PM | 6:30 to 9:00 PM | 11:00 PM to 1:30 AM | 12:30 to 3:00 AM | 2:30 to 5:00 PM |
Within the NY AM window, two clock references carry special weight for futures: the 8:30 AM ET data window (CPI, NFP, and most macro prints), whose releases regularly supply the day's manipulation leg, and the 9:30 AM ET equity open, whose first 30 to 60 minutes produce the sweep-and-reverse sequences this methodology hunts. The evening convenience of these windows across Asia is a real, practical reason ICT owns the markets our country guides cover: the primary killzone lands at 4:30 to 7:30 PM in Mumbai and 6:00 to 9:00 PM in Jakarta, after work, at maximum volume.
The Full Model: From Daily Bias to Entry
Assembled into a workflow, the methodology runs top-down through four questions each day:
- Where is the draw on liquidity? On the daily and 4-hour charts, identify the nearest untaken external pools (old highs/lows, equal extremes) and unfilled internal zones (higher-timeframe FVGs). The nearest compelling pool above versus below, weighed against structure, sets the day's directional bias: the market is presumed to be traveling toward liquidity.
- What did the overnight build? The Asia range's high and low become the first pools of the coming sessions; a tight Asia range followed by a London push in one direction is the classic accumulation-then-manipulation opening of the PO3 template, with the true move expected the other way during New York.
- Wait for the killzone, then the sequence. Inside the window, the entry requires the full chain in order: a sweep of a mapped pool, displacement back through it, a market structure shift, and an FVG or order block left by the displacement. Missing links mean no trade; the sequence is the setup, not any single ingredient.
- Enter on the retracement, target the opposing liquidity. Entry at the FVG (commonly its CE midpoint) or order block, ideally overlapping the OTE zone of the displacement leg; stop beyond the sweep extreme; first target at the nearest internal pool, terminal target at the opposing external pool, per the internal/external alternation heuristic. Note what this sequence is underneath the vocabulary: a failed-breakout reversal with a defined invalidation and a structure-based target, which is why it can be written down and tested.
Worked Trade 1: The NY AM Sweep Short on NQ
The canonical trade, with numbers. Context: the daily chart shows NQ in a range whose lower external pool (an old low at 21,250) remains untaken, setting a bearish draw. Overnight, Asia ranged 21,410 to 21,455. The previous day's high sits at 21,480 with equal highs from two afternoons at 21,482: a dense buy-side pool. London pushed up to 21,470 and stalled: the PO3 read is accumulation (Asia), manipulation up (London/NY open), distribution down.
- The sweep: at 9:38 AM ET, price runs to 21,489, seven points through the equal highs, on a spike. SMT check: ES pokes its equivalent level by a single tick and instantly rejects while NQ extends: the divergence flags the NQ push as a probable run on stops, not broad strength.
- Displacement and MSS: within four minutes, a heavy sell candle drives from 21,485 to 21,452, closing below the last 5-minute swing low at 21,458: structure shifted, with displacement, leaving a bearish FVG between 21,470 (candle 1 low) and 21,461 (candle 3 high): a 9-point gap with CE at 21,465.50.
- Entry: the retracement reaches the FVG and stalls at CE. Short at 21,465.50. The zone also sits at the 68 percent retracement of the displacement leg: inside OTE, stacking the location filters.
- Stop: above the sweep extreme with a buffer: 21,491, so 25.5 points of risk. The premise (the high was a terminal sweep) dies precisely there, nowhere earlier.
- Targets: first, the internal pool: an unfilled 5-minute FVG from the prior afternoon at 21,432 (+33.5 points, 1.3R): half off, stop to entry. Terminal, the sell-side pool at the prior day's low, 21,398 (+67.5 points, 2.6R). Both filled before the PM session.
- Funded sizing: 25.5 points on MNQ is $51 of risk per contract. On a $50K account with a $2,000 drawdown, that is 2.55 percent per micro: too big at 1 percent risk, period. The honest options: pass, or take the entry only on the tighter 1-minute FVG inside the displacement (stop above that gap rather than the full sweep high, roughly 11 points, $22, 1.1 percent) and accept that tighter invalidation means more stop-outs. ICT's wide sweep-anchored stops are structurally honest and structurally expensive; the sizing logic from our drawdown guide does not bend for vocabulary.
Worked Trade 2: The Failed Sweep (and the Filter It Teaches)
The methodology's characteristic loss is the sweep that was not a sweep: price runs the pool and keeps going, because the day is a genuine trend day and the "manipulation" was actually the real move's first leg. Setup: same map, price runs the equal highs at 21,482 to 21,490 in the killzone. You anticipate, shorting the first small pullback at 21,484 with a stop at 21,496 (12 points), before any displacement or MSS prints.
- What happens: the pullback is bought at the old high (the level flipping to support: acceptance, not rejection), a bullish FVG forms underneath, and price extends to 21,505. Stopped, minus 12 points.
- The error was sequence-skipping, not bad luck: the model's entry required displacement back through the swept level and a structure shift, and neither ever printed. The reclaim is the confirmation that distinguishes a sweep from a breakout; entering before it converts the strategy into "fade every new high," which is the exact trade the methodology exists to stop you making.
- The filters that catch trend days early: no reclaim within a defined window (if price has not traded back through the swept level within 15 to 20 minutes, it is acceptance); the profile-style read (volume building above the old high rather than a thin spike, exactly the acceptance test from our volume profile guide); an open-drive character to the session; and SMT agreement instead of divergence (ES confirming the new high alongside NQ). Any of these standing against you is the model itself saying no trade, and a day that takes buy-side liquidity and holds it typically becomes a day you look to buy pullbacks, not fight highs.
Tricks Practitioners Actually Use
- Grade the pool before trusting the sweep. Equal highs tested multiple times, visible on the hourly, beat a minor 5-minute swing high; sweeps of major external pools carry the reversals worth holding, while minor-pool grabs mostly produce scalps. Map three pools a day, not thirty.
- Enter at CE, not the gap's edge. Limit orders at the first touch of an FVG get filled by every shallow probe that then continues through; the 50 percent midpoint filters the weak touches and improves average entry, at the cost of missing some. The same logic applies to order blocks: the block's midpoint over its proximal edge.
- Buffer the stop beyond the sweep wick. The sweep extreme is itself an obvious level now; stops resting exactly at it are the next micro-pool. A few ticks of buffer is cheap insurance against the double-purge.
- Use SMT as a veto, not a signal. Divergence at a level does not initiate anything; agreement at a level cancels the fade. Used that way it is a pure filter with no discretion cost.
- Let the internal/external alternation write your targets. Entered on an external sweep? The first internal inefficiency is your partial, the opposing external pool the terminal. It removes the where-do-I-exit improvisation that ruins otherwise-good entries.
- One sequence per killzone. The model produces at most a couple of qualifying chains per session; the third "setup" of the window is nearly always a revenge trade wearing markup. This cap also happens to align you with the passer profile (roughly 3 trades a day) in the industry's behavioral data.
- Pre-write the day in one sentence. "Draw is on the low at X; I want a sweep of Y during NY AM, displacement down, entry in the gap, target X." If the day does not hand you your sentence, you do not trade, and that sentence is also your backtest log entry.
What to Avoid
- Sequence-skipping. The most common and most expensive error, as Worked Trade 2 showed: entering on the sweep without the reclaim, displacement, and MSS. The chain is the strategy; a link missing is a pass.
- Level pollution. Marking every 1-minute FVG and swing point produces a chart where price is always "at a level," which makes every impulse justifiable. Higher-timeframe zones only, three pools a day, or the tool becomes a rationalization engine.
- The manipulation narrative as an emotional loop. Losing a trade and concluding "they hunted my stop" converts a normal loss into a grievance, and grievances revenge-trade. The mechanical framing (my stop sat in an obvious cluster; that is a placement error, mine to fix) produces the identical map with none of the tilt.
- Wide stops without the sizing conversation. Sweep-anchored invalidations are honest and large; taking them on full-size contracts is how "one high-probability setup" ends a $2,000 drawdown in two trades. The size adjusts to the stop, never the reverse.
- Counter-trading news candles at full risk. The 8:30 print supplies beautiful sweeps and also the fastest slippage of the day, and several firms restrict or void trades around releases on funded accounts anyway. Know your firm's news rule before the window, not during it.
- Screenshot epistemology. Curated wins with hindsight-drawn boxes are the ecosystem's currency and prove nothing in either direction. Your logged forward-tests are the only ICT content that can make you money.
- Buying what is free. The core curriculum is free; the paid-mentorship layer atop it sells packaging. Any "funded in 30 days with my model" pitch should be read against the base rates in our pass-rate statistics.
The Honest Assessment
What the critics get right
Three criticisms land. First, flexibility: as commonly taught, the framework offers enough optional concepts, timeframes, and validity conditions that a chart can be re-marked after the fact to explain any outcome, and a system that explains everything predicts nothing. Second, the evidence gap: there is no peer-reviewed or independently audited demonstration that the full methodology outperforms, and the ecosystem's proof consists overwhelmingly of curated screenshots. Third, the intent narrative outruns the evidence: stop clusters demonstrably exist and levels demonstrably get swept, but the leap to a coordinated actor deliberately hunting your specific order is storytelling, and it carries the psychological cost catalogued above.
What the dismissals miss
The concepts are more mechanically respectable than the discourse suggests, largely because most of them predate ICT under older names: the liquidity sweep is Wyckoff's spring and upthrust, the order block is a supply/demand zone, the FVG is a price imbalance, the breaker is a polarity flip, and premium/discount is value-relative location. Rebranding is not refutation. The microstructure point deserves precision: research on stop clustering documents that stops do concentrate at prior extremes and round numbers and that price exhibits measurable behavior around such clusters, which supports the mechanical claim with no conspiratorial actor required; the sweep pattern can be real while the story about who causes it stays unproven. Most importantly, several components are precisely definable and therefore testable: an FVG is an objective three-candle arithmetic condition, a sweep-and-reclaim of a prior extreme is programmable, killzone timing is a session filter, and all of them can be backtested on futures data without a single subjective judgment. Whether those tests find edge on your market and timeframe is an empirical question with a knowable answer, which is a better position than most discretionary methodologies can claim.
If You Want to Actually Test It: A Protocol
Freeze one version of the sweep model into parameters and grade it like a system. A complete specification to start from: reference pool = prior RTH day's high/low or equal extremes within tolerance E ticks; sweep = trade beyond the pool by at least S ticks during the NY AM killzone; reclaim = a close back through the level within W minutes; displacement = the reclaim leg spans at least D × ATR(14) and leaves an FVG of minimum G ticks; entry = limit at the FVG's CE; stop = sweep extreme plus B ticks; exits = 50 percent at the nearest opposing internal zone, remainder at the opposing external pool, with a time stop at session end. Every letter is a number you choose once. Then: test components separately before the chain (sweep-reclaim alone, FVG fill rates alone, killzone effect alone), because the composite result cannot tell you which link carries the weight; demand a hundred-plus instances per condition across at least two volatility regimes; log your discretionary trades in the same format so the frozen system and your judgment can be compared on the same field; and forward-test in sim before an evaluation fee touches any of it. If the frozen model shows nothing on your market, the discretionary version was probably grading itself on a curve.
ICT and the Funded-Account World
The ICT-prop overlap is structural, not accidental. The setups produce exact entries and invalidations (the FVG boundary, the sweep extreme), which convert directly into contracts against a remaining drawdown, with the caveat Worked Trade 1 priced out: sweep-anchored stops are wide, and micro contracts plus the tighter internal-FVG invalidation are how the model fits a $1,000 to $3,000 drawdown at 1 percent risk. Killzone discipline compresses trading into one or two windows, fitting both the auto-flat day structures futures firms mandate and the international evening sessions in the timezone table. One-sequence-per-killzone trading naturally produces the moderate distributed profits that consistency rules reward. The risks run through the same channel: the manipulation narrative feeds revenge trading after stop-outs, "high probability" language invites oversizing, and evaluation deadlines amplify both, which is precisely the failing-trader profile (2 to 3 percent risk, 6.8 trades a day) in the industry's data.
ICT FAQ
What is ICT trading?
The methodology taught by Michael J. Huddleston (Inner Circle Trader), premised on price seeking liquidity and filling inefficiencies. Core tools: fair value gaps, order blocks, liquidity sweeps, market structure shifts, premium/discount zones, SMT divergence, and killzone session timing.
What is a fair value gap, and where do you enter it?
A three-candle imbalance where candle 1 and candle 3 never overlap. The common entry reference is consequent encroachment: the gap's 50 percent midpoint, which filters shallow touches at the cost of missing some fills.
What are the killzone times?
London open roughly 2:00 to 5:00 AM ET, New York AM roughly 7:00 to 10:00 AM ET (the primary window for index futures, containing the 8:30 data window and 9:30 equity open), New York PM 1:30 to 4:00 PM ET, Asia range 8:00 PM to midnight ET. The table above converts them for India, Indonesia, Brazil, and London.
What is SMT divergence?
Correlated instruments disagreeing at a level: ES making a new high while NQ fails flags the push as a probable stop run rather than broad strength. Best used as a veto on fades when the indices agree, rather than a standalone signal.
Does ICT actually work?
Unproven as a whole: no independent evidence exists, and the taught version contains enough discretion to resist falsification. But several components are mechanical, overlap with long-established concepts and documented microstructure effects, and can be honestly backtested. Freeze one setup into parameters and test it yourself before fees are at stake; the protocol above is a complete starting specification.
Why do prop traders love it?
Precise entries and invalidations fit drawdown-based sizing, killzone timing fits day-trading mandates and international evening sessions, and the content is free and everywhere. Popularity is a fact about the culture, not evidence of edge.
Is ICT a scam?
The core educational material is free, which distinguishes it from most guru ecosystems, and the concepts largely rebrand legitimate older ideas. The fair criticisms are about testability and the intent narrative, not fraud. The paid-mentorship layer built on top by others deserves the same skepticism as all trading education: test claims, ignore screenshots, size from your drawdown.
Educational content only, never personalized financial advice, and neither an endorsement nor a condemnation of any methodology or educator. Trading futures involves substantial risk of loss. Prop trading involves risk of losing evaluation fees; most participants do not reach a payout.