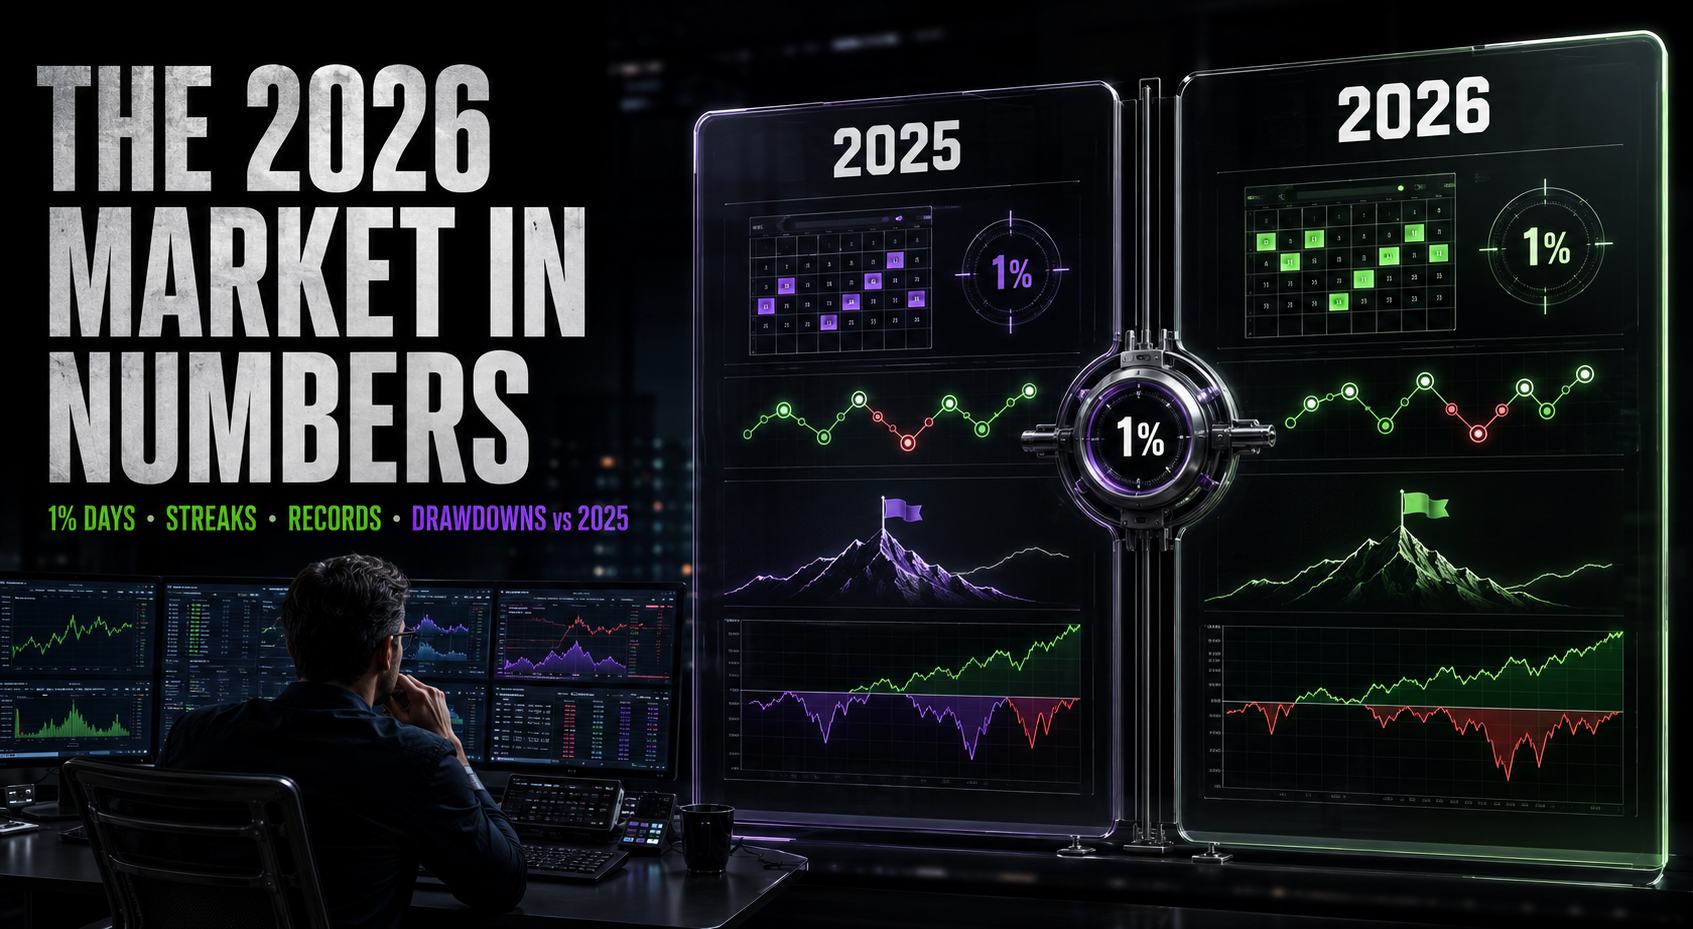
The 2026 Market in Numbers: 1% Days, Streaks, Records, and Drawdowns vs 2025
Traders argue about narratives; the tape keeps count. The stat bank for 2026 so far against 2025: how often the market actually moved 1 percent, the extremes, the streaks and up-day base rates, the record-high ledger, the drawdowns inside up-years, the volatility regime right now, and what all of it means for sizing a funded account.
 Tradeify
 My Funded Futures
 Top One Futures
 Alpha Futures
 Apex Trader Funding
 Lucid Trading
 BlueSky Funded
 Topstep
 Take Profit Trader
 Trade Day
 Phidias
 Earn2Trade
 Bulenox
 Funded Next Futures
 Blue Guardian Futures
 The Trading Pit
 Funded Futures Family
 E8 Markets
 Daytraders
 Elite Trader Funding
 Funded Futures Network
 Hola Prime
 Blueberry Futures
 Taurus Arena
 Humble Futures
 Legends Trading
 Futures Elite
 NexGen Protrader
 Funded Seat
 YRM Prop
Last updated: July 30, 2026
Traders argue about narratives; the tape keeps count. This is our stat bank for the 2026 market so far, set against 2025, built for the questions futures traders actually ask: how often has the market moved 1 percent or more, how violent were the extremes, what did the streaks and drawdowns look like, how many record highs got printed, and what the volatility regime is doing right now. Every figure is compiled from published market data and research as of the date above, with the as-of date attached wherever a number is still moving, because a stats piece that hides its timestamps is just a rumors piece with tables.
Methodology note: figures are drawn from index trackers and FactSet-based published research, cover the S&P 500 unless stated otherwise, and use closing-basis daily changes unless noted. 2026 figures are year-to-date and will have moved by the time you read this; treat every number as a snapshot with a date, not a live feed.
The Scoreboard: 2025 Final vs 2026 So Far
| Metric (S&P 500) | 2025 (full year) | 2026 (year-to-date) |
|---|---|---|
| Price return | +16.4% | +9.6% at the half; roughly +9.5 to +10% by late July |
| Total return (with dividends) | +17.9% | +10.2% at the half |
| Maximum drawdown | 18.9% peak to trough (the spring tariff crash) | ~9% in the first half |
| Record-high closes | 28 through Q3, more added in the year-end rally | 24 by July 1 (Nasdaq: 20), including the first close above 7,600 |
| Days with a move of 1%+ (either direction) | Slightly lower frequency than 2026's pace (see next section) | 27 of the first 112 sessions (24.1%), a ~60-day full-year pace |
| Signature shock | April tariff crash: ~12% down in three sessions, then the +9.5% single-day rebound | June Iran-war window: a volatility clump around the Strait of Hormuz headlines, then a ~2.7% pullback off the June 5 high |
| How the year felt at the midpoint | Up less than 2% at the end of June, after a crash and a V-recovery | Up 9.6%, the 12th first half since 1990 to clear 9%, and the smallest of that dozen |
The single most useful comparison in the table is the last row. At the 2025 midpoint the index had survived a 20 percent crash and was barely positive; at the 2026 midpoint it had absorbed a war, resurgent inflation, and Fed rate-hike risk and was up nearly 10 percent. Same market, entirely different path shapes, and path shape (not annual return) is what intraday traders actually live inside.
A Tale of Two First Halves
2025's path: a grinding start, then the spring break: the index fell roughly 20 percent from its late-winter peak into early April, including a roughly 12 percent drop across three sessions, before the tariff-delay announcement produced the year's defining print: April 9, 2025, up 9.5 percent in a single day (Nasdaq over 13 percent), with a 10.77 percent intraday range, the widest since December 2018. The recovery ran essentially uninterrupted into autumn: 28 record closes by the end of Q3, a 14.8 percent year-to-date gain at that point, and a finish at +16.4 percent despite ending the year on four straight down days. Full-year total return: +17.9 percent, the third straight year of double-digit gains, and unusually, over three-quarters of it driven by earnings growth rather than multiple expansion.
2026's path so far: a soft opening quarter (the first-half drawdown of roughly 9 percent front-loaded into it, with the index entering the year at a forward P/E near 22, one of the richest starting valuations on record), then the snapback: roughly +15 percent on the S&P and +21 percent on the Nasdaq from the end of March, the best quarter in six years, powered by an earnings season that delivered 27.9 percent S&P EPS growth on 11.7 percent revenue growth in Q1. June brought the Iran conflict, oil-supply anxiety, and the year's volatility clump, snapping a two-month winning streak with a roughly 1 percent monthly decline, and July has traded near the highs: the index crossed 7,600 for the first time during the first half, printed a 52-week range of roughly 6,213 to 7,621, and sits a short walk from record 25 as of this writing.
The Big-Move Census: How Often Does the Market Actually Move 1 Percent?
The number everyone wants and almost nobody tracks precisely. From FactSet-based research covering daily S&P moves back to 1928: through June 12, 2026, the index had posted 27 days with a move of 1 percent or more in either direction, out of 112 sessions: 24.1 percent of trading days, which annualizes to roughly 60 such days across 2026's 251 scheduled sessions if the pace holds. For context from the same dataset: that frequency is slightly above 2025's, slightly below 2023's, and far below the mega-volatility years of 2020 and 2022, which is to say 2026 has been almost exactly an average-volatility year by the long sweep of history, however loud it has felt. The feel-versus-fact gap has a mechanical explanation traders should internalize: big moves cluster. Volatility arrives in clumps (2025's clump was the April tariff window; 2026's was the first month of the Iran conflict), and because clumped big days dominate headlines and memory, every year feels wilder than its census.
The rare-club numbers put extremes in perspective. Since 1960, there have been just 23 weeks in which every single session moved 1 percent or more; raise the bar to 1.5 percent daily and it drops to 7 weeks; at 2 percent every day, it has happened exactly twice in modern history: once in 2008 and once in 2020. When you live through a five-for-five week, you are inside a once-every-few-years event, and both the risk math and the drawdown math should be treated accordingly.
Up Days, Down Days, and Streaks: The Base Rates
- The market's home-field advantage is small and real: across 1951 to 2025, 53.7 percent of S&P sessions closed up and 46.3 percent closed down; recent-era samples land in the same neighborhood (a 2015-2020 SPY study: 52.6 percent up days). The daily coin is only barely loaded, which is why day trading edges must come from selection and structure rather than from the drift.
- Streaks are ordinary, not signals: with a ~54/46 daily coin, multi-day runs occur constantly by chance alone: 2025 closed its banner year on a four-session losing streak, and 2026 ran a two-month monthly winning streak into June before the war headlines snapped it. Naively fading or chasing streaks has no statistical foundation; the streak that matters is the one your consistency rule is watching.
- Drawdowns inside up-years are the norm, not the exception: the average intra-year S&P decline since 1980 is about 14 percent, while most of those years still finished green. 2025 ran an 18.9 percent drawdown inside a +16.4 percent year; 2026 ran ~9 percent inside a +10 percent half. If your trading plan or account sizing cannot survive a normal year's interior weather, the calendar will eventually collect.
The Record-High Ledger
Record closes are the cleanest single indicator of trend persistence, and both years printed stacks of them: 2025 logged 28 through three quarters on its way to a strong finish; 2026 had logged 24 S&P record closes and 20 Nasdaq record closes by July 1, including the index's first-ever trip above 7,600, and entered late July within roughly 1.5 percent of another. For rotational futures traders the ledger matters practically: heavy record-high years are trend-regime years where the fade-everything reflex bleeds, exactly the environment distinction our volume profile guide builds its open-type playbooks around.
The Volatility Regime Right Now
| Gauge | Reading (late July 2026) | Context |
|---|---|---|
| VIX level | ~18.3 | Mid-range: below the ~20 long-run average, well off the year's fear peaks |
| VIX 52-week range | 13.38 to 35.30 | The high water marks the Iran-war clump; the low marks the calm stretches of the melt-up |
| VIX versus a year ago | Up roughly 33% | The regime is genuinely more volatile than mid-2025's post-recovery calm, while still historically ordinary |
| S&P 52-week range | 6,212.69 to 7,620.90 | A ~23% low-to-high span; price sits near the top of it |
The Cross-Asset Snapshot (Late July 2026)
| Market | Level | Worth Noticing |
|---|---|---|
| S&P 500 | ~7,405 | Near records; +9.5 to +10% YTD |
| Nasdaq Composite | ~24,733 | +12.8% YTD; the year's leadership, and the year's June wobble |
| Dow Jones | ~52,577 | +7% at the half; the laggard of the three |
| Russell 2000 | ~2,936 | Small caps still well below their relative glory years |
| Gold | ~$4,026 | Above $4,000: the inflation-and-geopolitics year in one number |
| WTI crude (front months) | ~$81 | Carrying the war premium that made CL the summer's event market |
| Bitcoin | ~$63,000 | Down sharply from its highs: 2026's notable cross-asset divergence, risk-on equities alongside risk-off crypto |
What the Numbers Mean for Funded Traders
- Size for the census, not the memory. 2026 is running an average-volatility tape (roughly one 1-percent day per week), which means the sizing that survived 2025's April or 2026's June clump is over-conservative for the median week, and the sizing tuned to calm weeks dies in the clumps. The professional answer is ATR-scaled stops and drawdown-based sizing that breathe with the regime, exactly the framework in the account size guide.
- Respect the clump when you are in one. Big days cluster, so the appearance of one 1.5-percent day materially raises the odds of neighbors. Inside a clump: widen stops or cut size, expect sweeps of obvious levels, and remember most firms' news-window rules exist precisely for these stretches; 70 percent of evaluation failures die on the loss limit, and clumps are where they do it.
- Match playbook to regime. Record-ledger trend years punish reflexive fading; clump windows punish reflexive breakout-chasing into exhaustion. The open-type and value-area diagnostics in the strategy guides are, at bottom, tools for reading which of this article's regimes today belongs to.
- Let the interior-drawdown base rate recalibrate your patience. A ~14 percent average intra-year decline inside mostly-green years means scary weeks are scheduled features of good years. Traders who internalize that stop revenge-trading the pullbacks and start trading their plans through them, which, per the behavioral data, is most of what separates the funded from the failed.
Market Stats FAQ
How many 1 percent days has the S&P 500 had in 2026?
Through June 12, 2026: 27 days with a move of 1 percent or more in either direction out of 112 sessions (24.1 percent of days), a pace of roughly 60 for the full year. That is slightly above 2025's frequency, slightly below 2023's, and far below 2020 and 2022, making 2026 a near-average volatility year by the data back to 1928.
How did 2026's first half compare to 2025's?
Night and day in path, similar in destination-speed: 2025 was up less than 2 percent at midyear after a roughly 20 percent crash and V-recovery, while 2026 was up 9.6 percent at the half (10.2 percent total return) with a ~9 percent maximum drawdown, the twelfth first half since 1990 to clear 9 percent.
What was the biggest single market day recently?
April 9, 2025 remains the modern standout: the S&P rose 9.5 percent (Nasdaq over 13 percent) on the tariff-delay announcement, with a 10.77 percent intraday range, the widest since December 2018, arriving days after a roughly 12 percent three-session decline.
How rare is a week where every day moves 1 percent?
Since 1960 it has happened only 23 times. At 1.5 percent every day, 7 times; at 2 percent every day, exactly twice (2008 and 2020). Full-week volatility of that kind is a once-in-years regime event, not a normal condition.
What percentage of days does the market close up?
About 53.7 percent up versus 46.3 percent down across 1951 to 2025, with recent samples similar. The daily edge from drift alone is tiny, which is why short-term trading edges must come from trade selection and structure rather than direction-by-default.
Where is the VIX in 2026?
Around 18 in late July 2026, inside a 52-week range of 13.38 to 35.30 and roughly a third higher than a year earlier: a genuinely livelier regime than mid-2025's calm, while still ordinary by long-run standards.
All figures compiled from published index data and FactSet-based market research as of July 30, 2026, on a closing-price basis unless noted; year-to-date figures change daily, imputed full-year paces are arithmetic conveniences rather than forecasts, and minor discrepancies between data providers are normal. Educational content only, never financial advice; past frequencies do not predict future ones. Prop trading involves risk of losing evaluation fees; most participants do not reach a payout.