Volume Profile Trading Explained: POC, Value Areas, and How Funded Traders Use Them
Volume profile shows where the market actually did business, not just where price went. Here is how to read POC, value areas, and low-volume nodes, the profile shapes that define a trading day, and why the tool fits funded futures accounts unusually well.
 Tradeify
 My Funded Futures
 Top One Futures
 Alpha Futures
 Apex Trader Funding
 Lucid Trading
 BlueSky Funded
 Topstep
 Take Profit Trader
 Trade Day
 Phidias
 Earn2Trade
 Bulenox
 Funded Next Futures
 Blue Guardian Futures
 The Trading Pit
 Funded Futures Family
 E8 Markets
 Daytraders
 Elite Trader Funding
 Funded Futures Network
 Hola Prime
 Blueberry Futures
 Taurus Arena
 Humble Futures
 Legends Trading
 Savius
 Futures Elite
 NexGen Protrader
 Funded Seat
 YRM Prop
 FundedNext
Last updated: July 13, 2026
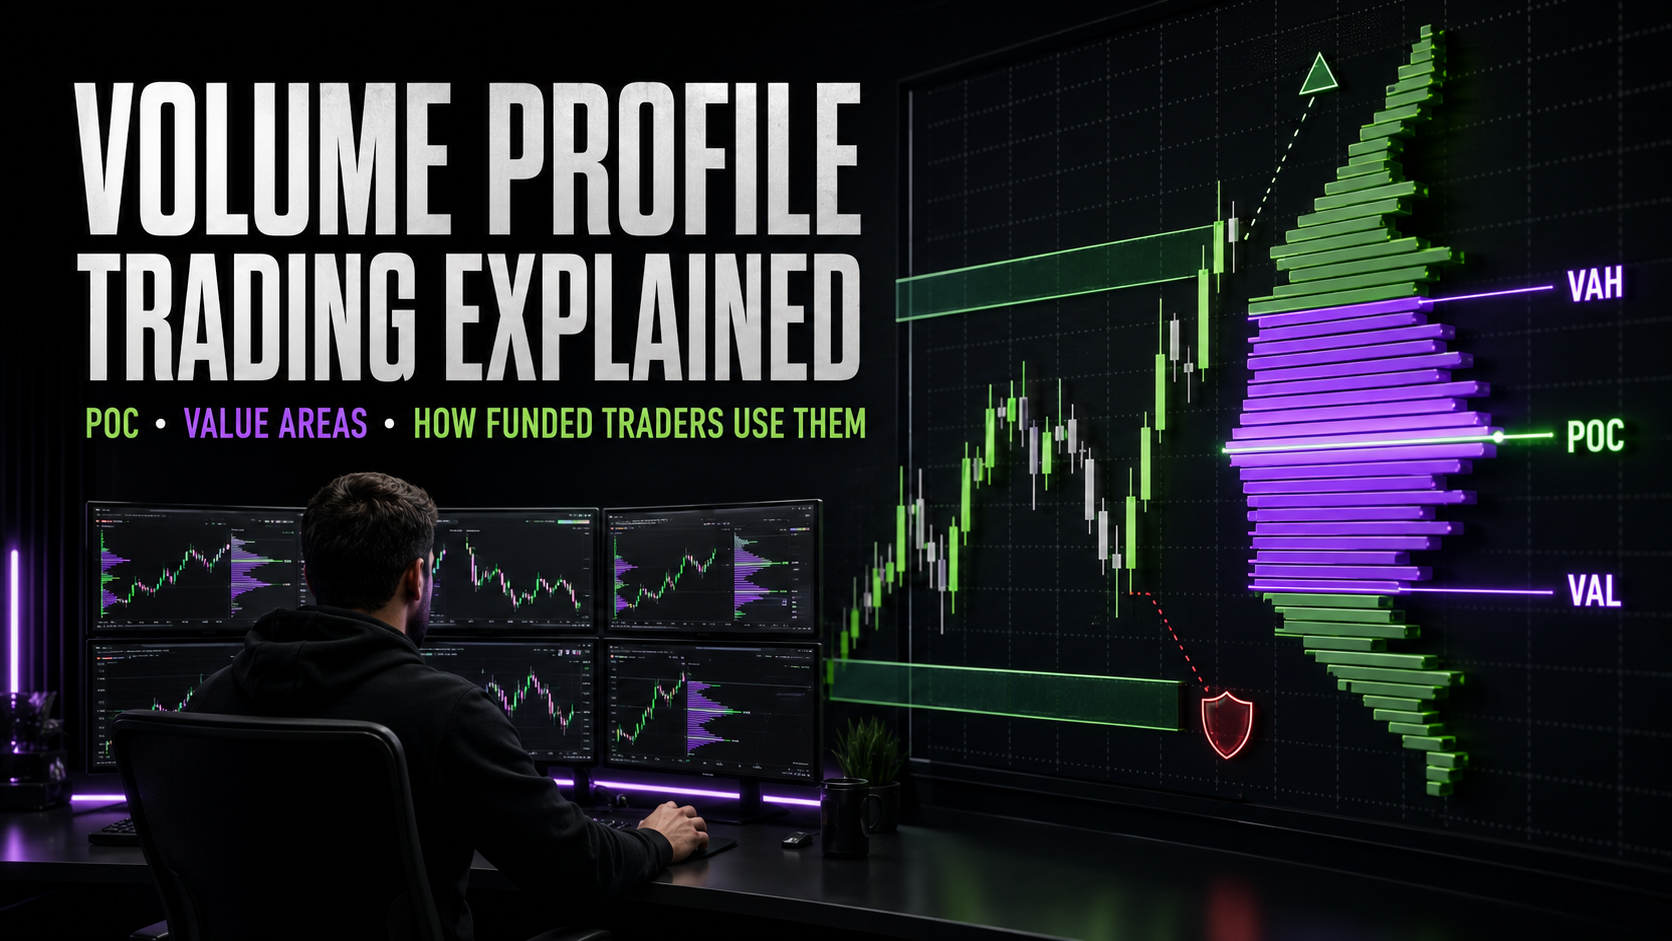
A normal chart tells you where price went. A volume profile tells you where the market actually did business, and the difference between those two things is where the strategy lives. Volume profile rotates the volume axis: instead of bars along the bottom showing volume per time period, it draws a horizontal histogram along the price axis showing volume per price level. The result is a map of agreement and disagreement: prices where thousands of contracts changed hands, and prices the market rejected so fast that almost nothing traded there.
This is the complete playbook, not a vocabulary tour. It covers how profiles are actually constructed and the settings that silently change your levels, the auction theory that makes the levels mean something, how the first hour's open type forecasts the day, three mechanical setups with entry, stop, and target rules, two fully numbered worked examples on ES and NQ, trade management and the acceptance-versus-rejection read, position sizing against a funded account's drawdown, a backtesting protocol, and the mistake catalog that breaks the tool for most people who try it.
What this is and is not: an educational explainer of a widely used methodology, not trade advice or a promise of edge. Any approach here should be tested in sim against your specific evaluation's rules before real fees are on the line.
How a Profile Is Actually Built (and the Settings That Change Your Levels)
Most volume profile losses trace back to something embarrassing: two traders looking at "the same" profile with different settings, holding different levels, and both calling them objective. Before the theory, the machinery.
- Volume profile versus Market Profile (TPO). They are cousins, not twins. Market Profile, the original Steidlmayer framework from the CBOT era, counts time at price: each 30-minute period that touches a level adds a letter. Volume profile counts contracts at price. They usually agree on structure, but they diverge exactly where it matters: when heavy volume trades fast through a level (lots of contracts, little time), volume profile shows an HVN where TPO shows nothing. For CME futures, where volume is real and centralized, volume profile is the primary tool; TPO's conceptual gifts (value areas, open types, the 80 percent rule) transfer directly onto it.
- Session definition: RTH versus ETH. A profile built on regular trading hours (9:30 am to 4:00 pm ET for equity index futures) produces materially different levels than one built on the full Globex session, because the overnight is a different auction with different participants. The convention most futures profilers use: RTH profiles for value areas and POCs, with overnight high and low tracked separately as their own reference levels. Whichever you choose, choose once; flipping between them mid-week is how you end up trading levels that exist only on your chart.
- Row size (tick aggregation). Profiles group prices into rows. On ES, a 1-tick row profile is noisy fuzz; a 4-tick (1-point) row is the common intraday standard; composites often use coarser rows. Finer rows move your POC by a tick or two and multiply false LVNs. Pick the row size that matches your timeframe and freeze it.
- Value area calculation. The value area is conventionally the tightest range around the POC containing 70 percent of the period's volume, built by expanding row by row from the POC outward. Every serious platform computes it the same way; the number to remember is that VAH and VAL are statistical boundaries (roughly one standard deviation of a normal-ish distribution), not lines someone drew. That is why price behaves differently inside versus outside them.
- Session, composite, and custom-range profiles. The session profile maps one RTH day and drives intraday decisions. The composite stacks weeks or months and reveals the larger balance your day trades inside, including the major HVN shelves and LVN corridors that intraday moves respect. Custom-range profiles (anchored to a swing low, an event, a breakout) answer "who is in control since X". A workable minimum: yesterday's session profile, a 20-day composite, and the developing (live-updating) profile of today.
The Vocabulary: Six Terms That Cover 90 Percent of It
| Term | Definition | Why It Matters |
|---|---|---|
| Point of Control (POC) | The single price with the most traded volume in the period | The session's fairest price; acts as a magnet and a rotation reference |
| Value Area (VA) | The range containing roughly 70 percent of the period's volume | Inside it, the market is negotiating; outside it, someone is being proven wrong |
| VAH / VAL | Value Area High and Low, the upper and lower boundaries of the VA | The primary decision prices: acceptance or rejection at these edges defines the day |
| High Volume Node (HVN) | A local bulge of heavy volume | Prior agreement; price tends to slow, rotate, and get sticky here |
| Low Volume Node (LVN) | A thin shelf where little traded | Prior rejection; price tends to traverse it fast, making LVNs natural stop and target zones |
| Naked POC | A prior session's POC that price has not revisited since | A standing magnet; markets show a persistent tendency to eventually tag them |
The Theory That Makes the Levels Mean Something
Levels without a model are astrology. The model behind profile trading is auction market theory, and it fits in four sentences. The market is a continuous two-way auction whose only job is to advertise price until it finds the area that produces trade (value), then rotate there until new information arrives. When price is inside value, the auction is balanced: responsive traders fade the edges and the market chops around the POC. When price moves outside value, the auction is asking a question: is this new price accepted (the market builds volume and time out here, value migrates, initiative traders win) or rejected (the excursion trades thin, snaps back inside, responsive traders win)? Every profile setup in existence is a bet on the answer to that one question at a specific level.
The practical vocabulary of acceptance versus rejection, since you will use it in every trade below: acceptance looks like price spending time at the new level, building visible volume rows there, and holding retests from the far side. Rejection looks like speed: single prints, a thin tail on the profile, a fast reversal back through the level, and no volume left behind. You can read this live off the developing profile with no other tools: is the histogram fattening at this price, or did price visit and leave nothing behind?
Reading the Day: The Four Profile Shapes
The shape a profile builds during the session is a live diagnosis of what kind of day you are in, which is the whole game, because the correct strategy inverts between balanced and trending days.
- The D-shape (balance day). A symmetric bell with a fat middle: two-sided trade around an agreed value. The playbook is rotational: fade the value area edges back toward the POC. Most sessions are some version of this.
- The P-shape. Volume bunched high with a thin tail below: aggressive buying that trapped shorts, classic in rallies and short-covering. The thin tail marks rejected prices; longs against the lower edge of the bulge are the conventional read, and a return into the tail is a warning.
- The b-shape. The mirror image: volume bunched low with a thin tail above, typical of liquidation breaks. Same logic inverted.
- The double distribution (trend day). Two distinct bulges separated by a thin LVN corridor: the market accepted one value, repriced violently, and accepted another. This is the shape that punishes faders, because the balanced-day playbook of selling strength has you fighting a repricing. The LVN corridor between the distributions becomes the line in the sand: holding beyond it confirms the new value; trading back through it fast is the failure signal.
The First Hour Tells You Which Playbook Applies: Open Types
Day-type diagnosis does not have to wait for the profile shape to finish printing. The character of the open, a Market Profile concept that transfers straight to volume profiling, forecasts it within the first 30 to 60 minutes:
| Open Type | What It Looks Like | What It Implies | Playbook Bias |
|---|---|---|---|
| Open-drive | Price leaves the open immediately and one-directionally, never returning to the opening price | Conviction from the start; highest trend-day probability | Do not fade; join pullbacks toward the drive; expect double distribution |
| Open-test-drive | Price probes one direction (often tagging a reference like the overnight low), fails, then drives the other way | The failed test cleared the auction; strong directional conviction after the turn | The failed-test extreme is a high-quality stop anchor; trade with the drive |
| Open-rejection-reverse | Price moves away from the open, gets rejected, and comes back through it | Moderate conviction; two-sided trade likely | Rotational setups acceptable with confirmation |
| Open-auction | Price chops around the open with no initiative in either direction | Balance; nobody has new information | Full rotational playbook: fade value edges, target the POC |
The discipline this table buys you is the one that keeps rotation traders alive: an open-drive morning cancels the fade playbook before your first entry, not after your third stop-out.
The Pre-Market Routine: Building the Day Map
Profile trading is 80 percent preparation. The working map, built in ten minutes before the open, marks in order of importance:
- Yesterday's VAH, VAL, and POC. The core decision levels for today's open location.
- All naked POCs within reach, above and below, with their dates. These are your standing magnets and preferred targets.
- The overnight high and low. The Globex session's extremes: common early-session liquidity targets and reversal spots.
- Composite HVNs and LVNs from the 20-day profile: the shelves and corridors that tell you what happens beyond yesterday's range (an LVN corridor above yesterday's high means a breakout has vacuum to travel; a composite HVN there means it hits a wall).
- Where the open is forming relative to value: inside yesterday's VA (balance likely, rotation playbook), outside VA but inside range (mild imbalance), or outside yesterday's range entirely (true imbalance, the highest-information opens: today either accepts new value out here or produces the 80 percent rule trade back through the old one).
Setup 1: Value-Area Rotation and the 80 Percent Rule
The balance-day workhorse, in its two forms.
The interior fade. Conditions: open-auction or open-rejection open type, price inside yesterday's value, no scheduled news imminent. Entry: at VAH or VAL on evidence of rejection (thin volume printing beyond the edge, a fast tail, a failure to build rows outside). Stop: beyond the edge, past the nearest LVN, so only genuine acceptance outside value takes you out. Targets: the POC first, the opposite value edge second. The regime check is non-negotiable: the moment the developing profile starts building a second distribution beyond the edge you faded, the balance premise is dead and so is the trade.
The 80 percent rule. The classical version: price opens outside the prior value area, re-enters it, and holds inside for two consecutive 30-minute periods; when that condition completes, the odds strongly favor a traverse of the entire value area to the far side. Modern intraday implementations relax the two-period clock into an acceptance read (rows building inside value, retest of the VA edge holding from the inside), but the structure is identical: entry on confirmed re-entry, stop back outside the edge you came through, target the opposite boundary, with the POC as the natural partial.
Worked example: an 80 percent rule long on ES
Yesterday's ES value area: VAL 6,280.00, POC 6,291.00, VAH 6,302.00. Today opens at 6,272.50, below value, on a soft overnight. The first 30 minutes probe down to 6,268.00, find nothing (thin prints, no rows building), and price re-enters value at 6,280. Over the next two 30-minute periods price holds inside, building volume at 6,282 to 6,285 and retesting 6,280 once from above, which holds. Condition complete.
- Entry: 6,283.00 on the successful retest hold.
- Stop: 6,277.75, one point below VAL plus a tick buffer: 5.25 points (21 ticks) of risk. The stop is where the premise dies: acceptance back below value voids the rule.
- Targets: POC 6,291.00 as the partial (+8 points, roughly 1.5R), VAH 6,302.00 as the terminal (+19 points, roughly 3.6R). Standard management: half off at the POC, stop to entry, remainder to VAH.
- Funded sizing: on a $50K evaluation with a $2,000 drawdown risking 1 percent of the real account ($20): 21 ticks on one MES is 21 × $1.25 = $26.25, slightly over budget, so this is one MES at a stretched 1.3 percent or a pass; at 2 contracts MES you would be risking 2.6 percent, which is the failing-trader zone in the industry's behavioral data. The level did not change to accommodate your ambition; the size does.
Setup 2: LVN Behavior (Acceleration and Rejection)
Low volume nodes are prices the market previously refused to spend time at, and they behave that way again: price entering an LVN tends to traverse it quickly toward the next HVN, because there is no memory, no trapped inventory, and no resting interest to slow it down. Three distinct uses:
- As targets: when positioned before an LVN corridor, the far side of the corridor (the next HVN) is the objective, and the traversal itself is usually the fastest part of the trade. This pairs naturally with breakout entries: a balance break that exits through an LVN has vacuum to travel; one that exits into a composite HVN is walking into a wall, and the map knew that before entry.
- As stop locations: a stop placed just beyond an LVN means only a genuine repricing through previously rejected territory takes you out, which is precisely the condition under which you want to be out.
- As failure detectors: price entering an LVN and stalling (building rows inside the corridor) is doing something it "should not" do, and that anomaly is information: the traversal premise is failing, and whoever needed the traversal is trapped.
Setup 3: Naked POC Retests (the Magnet Trade)
Prior-session POCs that were never revisited act as standing reference magnets, and price shows a persistent tendency to eventually tag them, sometimes days later. Implementation notes that separate the professionals from the level-collectors: keep a dated list of all untested POCs above and below (the map's cheapest and highest-value component); prefer naked POCs as targets for existing positions over standalone entries, because "eventually" is not a timestamp; and when price does tag one, treat the first touch as a reaction point worth watching, since old fair prices frequently produce at least a bounce, with the acceptance-versus-rejection read deciding whether the bounce is the trade or the pause before continuation. A useful auxiliary statistic to test yourself (the backtest section below shows how): what fraction of naked POCs within one ATR of the close get tagged within N sessions on your market. Knowing your market's number converts folklore into a plannable target rate.
Trade Management: Reading Acceptance While in the Position
Profile trades are managed with the same tool that found them. In a rotation long from VAL, the healthy signature is rejection behind you (thin prints below the edge) and progressive row-building ahead of you as price rotates up. Three management rules that survive contact with reality: first, the POC partial is nearly mandatory on rotation trades, because the POC is precisely where two-sided trade resumes and progress stalls; banking half there converts a good read into a paid read. Second, move the stop on structure, not on feelings: after the POC partial, entry-level is the natural stop for the runner, and thereafter the most recent accepted shelf (the last place rows built) trails it. Third, time is information: a rotation trade that goes nowhere for 30 to 45 minutes while the profile fattens at your entry price has lost its edge even without hitting the stop; balance that refuses to rotate is usually loading for a break, and you are positioned for the wrong regime. Scratching stale trades is a profit center in this methodology, not an admission of error.
Combining the Profile With Other Tools
- With VWAP: the session VWAP and its standard deviation bands describe the developing day's average; the profile describes its structure. Confluence trades (VAL coinciding with VWAP's lower band on a balance day) stack independent evidence, and divergence is diagnostic: price above VWAP but below the POC is a market whose average and whose acceptance disagree, which usually resolves violently.
- With patterns: continuation patterns grade context poorly on their own, and the profile is the context. A bull flag forming just below an LVN corridor, breaking into thin volume, is the same pattern with a tailwind; the identical flag forming under a composite HVN is asking to fail.
- With liquidity concepts: the overnight high and low, prior-day extremes, and equal highs that ICT traders map as liquidity pools are the same reference prices the profile frames as untested extremes and single prints; a sweep of the overnight low that reverses back into value is simultaneously an ICT setup and an 80 percent rule candidate, which is less a coincidence than two vocabularies describing one auction.
The Mistake Catalog
- Trading levels without a day-type thesis. VAL is a buy on a balance day and a bus stop on a liquidation day. The level means nothing without the regime; the open type and developing shape are the regime.
- Fading the double distribution. The single most expensive profile error: applying responsive logic to an initiative day. The tell is always the same: rows building beyond the value edge. Acceptance outside value is the fade's obituary; read it in real time.
- Level clutter. Twelve profiles and forty lines produce a level within noise distance of every price, which makes every entry justifiable and none of them meaningful. The map above has five components. If two levels sit within a few ticks, they are one zone.
- Treating the POC as support. The POC is a magnet and a rotation axis, not a floor. Price slices through POCs routinely; what it does less routinely is ignore them entirely, which is why they are targets and reference points rather than entries.
- Settings drift. Changing session definitions or row sizes until the profile agrees with the trade you want is curve-fitting with extra steps. Freeze the configuration, then obey it.
- Ignoring the calendar. A scheduled 8:30 or 10:00 release invalidates the developing structure on both sides of it. The profile describes an auction; a news print starts a new one.
Backtesting the Profile Honestly
Profile concepts are testable, which is rare and valuable among discretionary-looking methodologies. A protocol that produces real answers: compute daily VAH/VAL/POC from RTH data at your frozen row size (most platforms export these; a few dozen lines of code reproduce them from time-and-sales or minute data). Then test the claims separately, because they are separate hypotheses: (1) the 80 percent rule as a mechanical system (open outside value, re-entry, two-period hold, target the far edge, stop outside): win rate, average R, and, critically, results split by open type, since the rule's edge concentrates on non-drive opens; (2) naked POC tag rates within N sessions, by distance from the close; (3) LVN traversal speed versus HVN traversal speed (bars to cross equal-sized zones), which validates or kills the vacuum thesis on your market. Sample-size discipline applies as it always does: a hundred-plus instances per condition, split across at least two volatility regimes, before a conclusion earns your money. If the mechanical versions show nothing on your market and timeframe, the discretionary versions were unlikely to be better; you were just grading them more kindly.
Why This Fits Funded Accounts So Well
- It is futures-native. Volume profile needs real centralized volume, which is exactly what CME futures provide and what forex CFDs lack. On ES, NQ, and CL, the histogram means what it claims to mean.
- Objective levels make the drawdown math precise. Prop risk lives in the drawdown, not the account balance, and profile levels are known before entry: the stop distance to the far side of an LVN is a fixed number of ticks, which converts directly into position size against your remaining drawdown, as the ES example above showed to the dollar. Our drawdown guide covers why that sizing discipline is the difference between the 14 percent who pass and the rest.
- Rotation trading is consistency-rule friendly. Value-area rotation produces frequent moderate wins rather than rare home runs, which is precisely the profit distribution that consistency rules reward, and the POC-partial habit reinforces it structurally.
- The one-good-trade rhythm suits evaluations. The pre-market map plus the open-type filter typically yields one or two qualifying setups per session, which aligns with the passer profile in the industry's behavioral data (3.2 trades per day) rather than the failer profile (6.8).
- The tooling is already in prop platform bundles. Volumetrica (included at several newer firms), Sierra Chart, Quantower, ATAS, and NinjaTrader's order-flow package all carry native profiles, so the capability is frequently part of what your evaluation fee already bought.
- The honest limitation: profiles describe where volume happened, not why, and levels fail exactly when regimes change. The double-distribution day exists to punish anyone who treats VAH and VAL as guarantees. The tool ranks probabilities; the stop does the actual risk management.
Volume Profile FAQ
What is volume profile?
A study displaying traded volume per price level as a horizontal histogram, revealing the POC (heaviest price), the value area (roughly 70 percent of volume), and the high and low volume nodes that act as the session's structural map.
What is the point of control?
The single highest-volume price of the period: the session's fairest price, a rotation magnet, and, when left untested on later days (a naked POC), a standing target markets tend to eventually revisit.
What is the 80 percent rule?
Open outside the prior value area, re-enter, hold inside (classically two 30-minute periods), and the odds favor a traverse of the whole value area. Implemented as entry on confirmed re-entry, stop back outside the edge, target the far boundary with a POC partial.
Volume profile or Market Profile (TPO)?
Volume profile counts contracts at price, TPO counts time at price. For CME futures, volume profile is the primary tool; TPO's concepts (open types, value areas, the 80 percent rule) transfer directly onto it. They diverge when heavy volume trades fast at a level the market spent little time at.
Volume profile or VWAP?
Both: VWAP is the session's evolving average line, the profile is the full distribution around it. They answer different questions, and their disagreements (price above VWAP but below the POC) are themselves diagnostic.
Does it work in prop firm evaluations?
The fit is unusually good: futures-native volume, objective pre-known levels for drawdown-based sizing, a rotational style that suits consistency rules, and native support in most prop platform bundles. It remains a probability tool, not a guarantee; test it in sim against your evaluation's specific rules first.
Educational content only, never personalized financial advice or a recommendation to trade any strategy. Trading futures involves substantial risk of loss. Prop trading involves risk of losing evaluation fees; most participants do not reach a payout.